Identity Verification System (SVJ) and General Register of Gaming Access Bans (RGIAJ)
Identity Verification System (SVJ)
The controls on access to gambling are aimed at protecting vulnerable groups, especially minors and those registered in the General Register of Gaming Access Bans (RGIAJ). Since both groups cannot access gambling, either by legal order, by public health or by individual decision, in order for a person to have access to any online gambling, it is obligatory that operators perform a prior verification of the gambler's identity and use secure accreditation mechanisms. The DGOJ places at the disposal of operators the online mechanisms required to carry out both of the above-mentioned checks electronically.
For the purpose of facilitating the participant identity check process for operators, the DGOJ makes an Identity Verification System available, based on the data contained in the register of the Ministry of the Interior, allowing them to verify in real time the data of potential users who for identification purposes provide their national identity document number or foreigner identification number.
|
|
2012 | 2013 | 2014 | 2015 | 2016 | 2017 |
|---|---|---|---|---|---|---|
|
Requests for verification |
1,700,000 | 2,433,820 | 2,642,095 | 3,960,035 | 3,925,557 | 3,808,309 |
|
Positive verification requests |
42.5% | 58.24% | 68.52% | 84.71% | 73.71% | 76.94% |
|
Increase on previous year |
8.56% | 49.88% | 3% | -3% |
Regarding the number of queries by gambling operators in relation to the use of the previous verification service or the electronic means enabled to use the electronic office:
| 2015 | 2016 | 2017 | |
|---|---|---|---|
| Support mailbox for operators | 303 | 268 | 193 |
| Electronic office/incident mailbox | 289 | 140 | 156 |
| Telephone queries | 72 | ||
| Total | 592 | 408 | 421 |
General Register of Gaming Access Bans (RGIAJ)
On the other hand, prior to allowing a user access to online gambling activities, the gambling operator is obliged to verify their possible registration in the General Register of Gambling Access Bans, administered by the DGOJ, which is responsible for its effective functioning and control. This register, in which anyone can be included, at their own request or by a court order, enables exclusion from participation in gambling activities that require the verification referred to above (both remote and in-person) throughout Spain. The registration in the General Register of Gambling Access Bans can be made through the use of a form presented in-person at a public registry of any Public Administration or through the electronic office of the DGOJ, which, through that means, is immediately effective. For detailed information about the General Register of Gambling Access Bans, consult the section for this purpose on the Directorate-General's website.
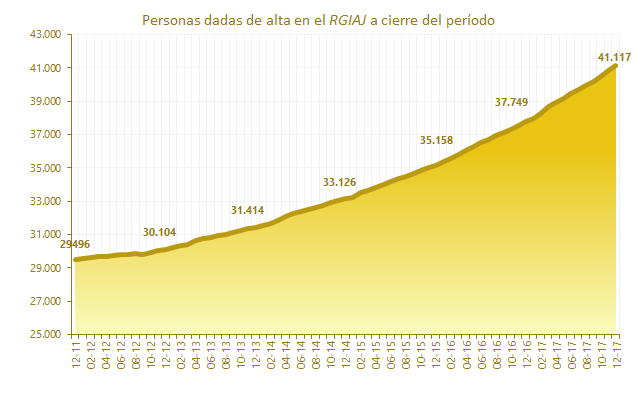
The evolution of the registrations in the aforementioned registry is set out in the following chart, with the evolution of the number of registrations shown below:
|
|
2012 |
2013 |
2014 |
2015 |
2016 |
2017 |
|---|---|---|---|---|---|---|
|
Total registrations |
1,270 |
2,060 |
2,352 |
2,874 |
3,563 |
4,528 |
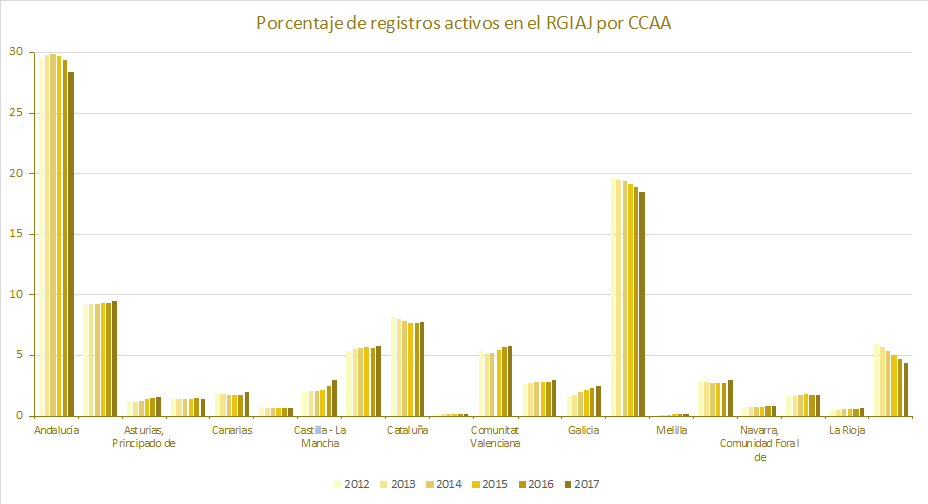
The distribution of active registrations by Autonomous Community is shown in the following graph and table:
(click on the image to view it full size)
| AUTONOMOUS COMMUNITY | 2012 | 2013 | 2014 | 2015 | 2016 | 2017 |
|---|---|---|---|---|---|---|
| Andalusia | 29.46 | 29.79 | 29.83 | 29.70 | 29.38 | 28.37 |
| Aragon | 9.11 | 9.22 | 9.24 | 9.25 | 9.33 | 9.44 |
| Asturias, Principality of | 1.11 | 1.09 | 1.23 | 1.36 | 1.50 | 1.57 |
| Balearic Islands | 1.40 | 1.41 | 1.40 | 1.41 | 1.44 | 1.43 |
| Canary Islands | 1.83 | 1.83 | 1.78 | 1.75 | 1.77 | 1.87 |
| Cantabria | 0.66 | 0.63 | 0.63 | 0.62 | 0.62 | 0.63 |
| Castile-La Mancha | 1.92 | 1.96 | 2.00 | 2.10 | 2.43 | 2.96 |
| Castile-Leon | 5.33 | 5.49 | 5.58 | 5.63 | 5.60 | 5.70 |
| Catalonia | 8.20 | 8.00 | 7.78 | 7.67 | 7.68 | 7.70 |
| Ceuta | 0.17 | 0.16 | 0.16 | 0.16 | 0.18 | 0.18 |
| Valencia Region | 5.28 | 5.15 | 5.23 | 5.42 | 5.62 | 5.77 |
| Extremadura | 2.61 | 2.69 | 2.77 | 2.78 | 2.82 | 2.95 |
| Galicia | 1.63 | 1.77 | 1.88 | 2.11 | 2.25 | 2.41 |
| Madrid, Community of | 19.65 | 19.46 | 19.35 | 19.09 | 18.86 | 18.45 |
| Melilla | 0.11 | 0.11 | 0.10 | 0.15 | 0.16 | 0.19 |
| Murcia, Region of | 2.83 | 2.79 | 2.73 | 2.72 | 2.66 | 2.96 |
| Navarre, Chartered Community of | 0.67 | 0.68 | 0.72 | 0.72 | 0.74 | 0.77 |
| Basque Country | 1.71 | 1.65 | 1.77 | 1.81 | 1.74 | 1.75 |
| Rioja, La | 0.42 | 0.44 | 0.49 | 0.51 | 0.55 | 0.60 |
| No autonomous community data | 5.91 | 5.68 | 5.33 | 5.04 | 4.67 | 4.30 |
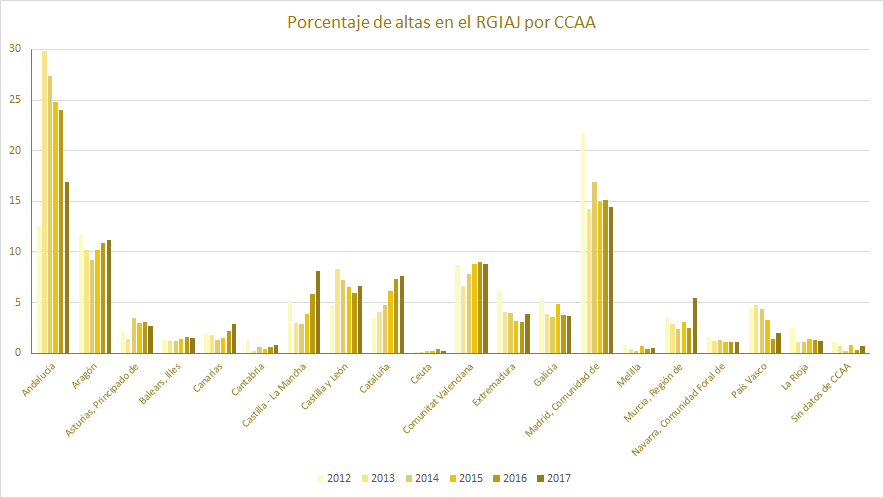
The distribution of the registrations by Autonomous Community detailed in the corresponding registration requests can be seen in the following graph and table:
(click on the image to view it full size)
| AUTONOMOUS COMMUNITY | 2012 | 2013 | 2014 | 2015 | 2016 | 2017 |
|---|---|---|---|---|---|---|
| Andalusia | 12.51 | 29.81 | 27.38 | 24.84 | 24.02 | 16.87 |
| Aragon | 11.64 | 10.19 | 9.23 | 10.16 | 10.92 | 11.20 |
| Asturias, Principality of | 2.12 | 1.36 | 3.49 | 2.99 | 3.12 | 2.65 |
| Balearic Islands | 1.34 | 1.21 | 1.15 | 1.36 | 1.60 | 1.48 |
| Canary Islands | 1.89 | 1.80 | 1.32 | 1.46 | 2.19 | 2.89 |
| Cantabria | 1.18 | 0.24 | 0.64 | 0.45 | 0.56 | 0.77 |
| Castile-La Mancha | 5.19 | 3.01 | 2.89 | 3.83 | 5.87 | 8.11 |
| Castile-Leon | 4.72 | 8.35 | 7.19 | 6.51 | 5.98 | 6.65 |
| Catalonia | 3.46 | 4.08 | 4.72 | 6.09 | 7.30 | 7.64 |
| Ceuta | 0.16 | 0.10 | 0.21 | 0.21 | 0.45 | 0.22 |
| Valencia Region | 8.73 | 6.65 | 7.78 | 8.84 | 9.01 | 8.83 |
| Extremadura | 6.14 | 4.03 | 3.95 | 3.17 | 3.06 | 3.84 |
| Galicia | 5.35 | 3.83 | 3.61 | 4.84 | 3.73 | 3.62 |
| Madrid, Community of | 21.72 | 14.27 | 16.88 | 14.93 | 15.10 | 14.42 |
| Melilla | 0.79 | 0.39 | 0.17 | 0.73 | 0.39 | 0.46 |
| Murcia, Region of | 3.54 | 2.91 | 2.42 | 3.10 | 2.53 | 5.43 |
| Navarre, Chartered Community of | 1.57 | 1.17 | 1.28 | 1.08 | 1.12 | 1.06 |
| Basque Country | 4.41 | 4.76 | 4.38 | 3.31 | 1.43 | 2.01 |
| Rioja, La | 2.40 | 1.12 | 1.11 | 1.36 | 1.32 | 1.17 |
| No autonomous community data | 1.10 | 0.73 | 0.21 | 0.77 | 0.31 | 0.66 |
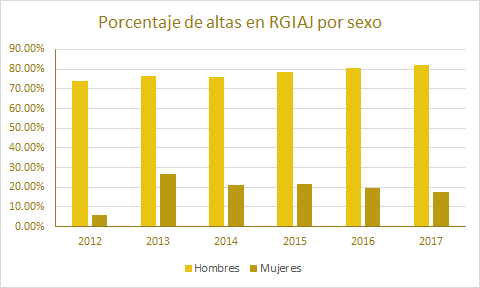
In terms of distribution by sex and age, the historical accumulated results are as follows:
| 2012 | 2013 | 2014 | 2015 | 2016 | 2017 | |
|---|---|---|---|---|---|---|
| Men | 74.20% | 73.35% | 75.93% | 78.58% | 80.49% | 82.34% |
| Women | 25.80% | 26.65% | 24.07% | 21.42% | 19.51% | 17.66% |
.png)
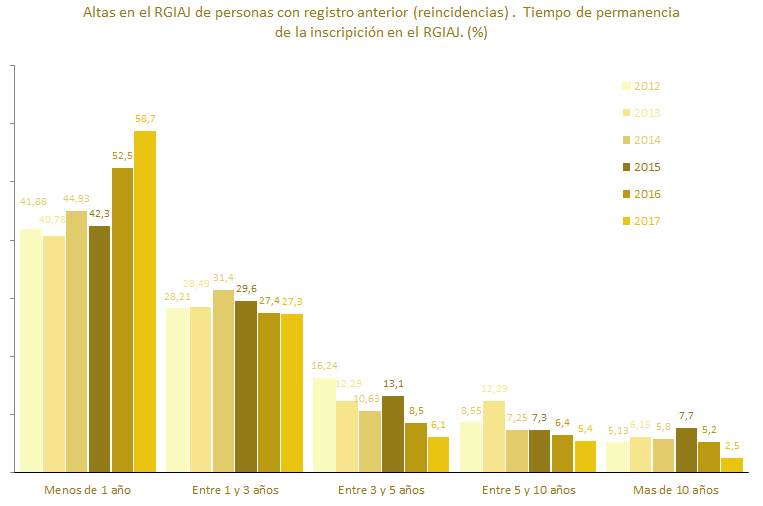
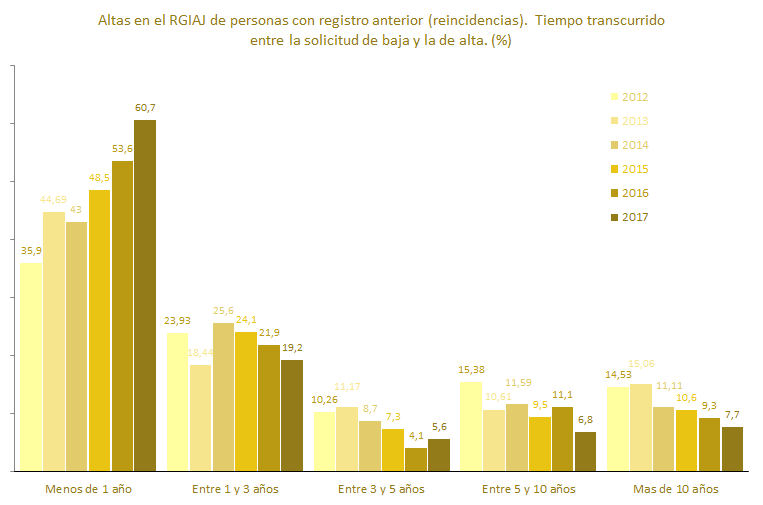
The most relevant data on those who re-register in the general register of gambling access bans and, in particular, the time during which the previous registration was valid prior to the new application, as well as the time elapsed between the removal request and the new registration request are as follows:
|
|
2012 |
2013 |
2014 |
2015 |
2016 |
2017 |
|---|---|---|---|---|---|---|
|
Percentage of relapsed registrations on total registrations in the year |
9.21 |
8.69 |
8.80 |
9.53 |
9.63 |
9.78 |
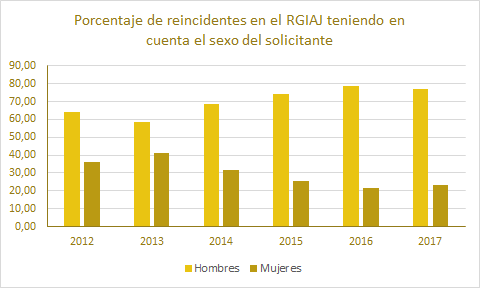
In terms of analysis relating to the age and sex of those who relapse, we find the following data:
| 2012 | 2013 | 2014 | 2015 | 2016 | 2017 | |
|---|---|---|---|---|---|---|
| Men | 64.10% | 58.66% | 68.60% | 74.45% | 78.43% | 76.98% |
| Women | 35.90% | 41.34% | 31.47% | 25.55% | 21.57% | 23.02% |
.png)
The evolution of removal requests for each year can be seen in the following graph:
|
|
2012 |
2013 |
2014 |
2015 |
2016 |
2017 |
|---|---|---|---|---|---|---|
|
Total de-registrations |
662 |
750 |
640 |
841 |
972 |
1,159 |
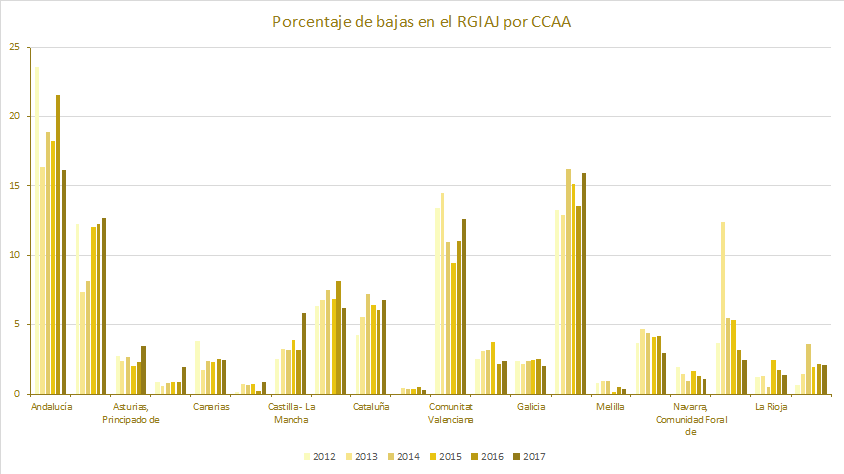
The distribution of the de-registrations by Autonomous Community detailed in the corresponding de-registration requests can be seen in the following graph and table:
(click on the image to view it full size)
| AUTONOMOUS COMMUNITY | 2012 | 2013 | 2014 | 2015 | 2016 | 2017 |
|---|---|---|---|---|---|---|
| Andalusia | 23.56 | 16.4 | 18.91 | 18.19 | 21.5 | 16.13 |
| Aragon | 12.24 | 7.33 | 8.13 | 12.01 | 12.24 | 12.68 |
| Asturias, Principality of | 2.72 | 2.40 | 2.66 | 2.02 | 2.26 | 3.45 |
| Balearic Islands | 0.91 | 0.53 | 0.78 | 0.83 | 0.82 | 1.90 |
| Canary Islands | 3.78 | 1.73 | 2.34 | 2.26 | 2.57 | 2.50 |
| Cantabria | 0.15 | 0.67 | 0.63 | 0.71 | 0.21 | 0.86 |
| Castile-La Mancha | 2.57 | 3.20 | 3.13 | 3.92 | 3.19 | 5.87 |
| Castile-Leon | 6.34 | 6.80 | 7.50 | 6.90 | 8.13 | 6.21 |
| Catalonia | 4.23 | 5.60 | 7.19 | 6.42 | 6.07 | 6.82 |
| Ceuta | 0.00 | 0.40 | 0.31 | 0.36 | 0.51 | 0.26 |
| Valencia Region | 13.44 | 14.53 | 10.94 | 9.39 | 11.01 | 12.60 |
| Extremadura | 2.57 | 3.07 | 3.13 | 3.69 | 2.16 | 2.42 |
| Galicia | 2.42 | 2.13 | 2.34 | 2.50 | 2.57 | 1.98 |
| Madrid, Community of | 13.29 | 12.93 | 16.25 | 15.10 | 13.58 | 15.96 |
| Melilla | 0.76 | 0.93 | 0.94 | 0.12 | 0.51 | 0.35 |
| Murcia, Region of | 3.63 | 4.67 | 4.38 | 4.16 | 4.22 | 2.93 |
| Navarre, Chartered Community of | 1.96 | 1.47 | 0.94 | 1.66 | 1.34 | 1.12 |
| Basque Country | 3.63 | 12.4 | 5.47 | 5.35 | 3.19 | 2.50 |
| La Rioja | 1.21 | 1.33 | 0.47 | 2.50 | 1.75 | 1.38 |
| No autonomous community data | 0.60 | 1.47 | 3.59 | 1.90 | 2.16 | 2.07 |
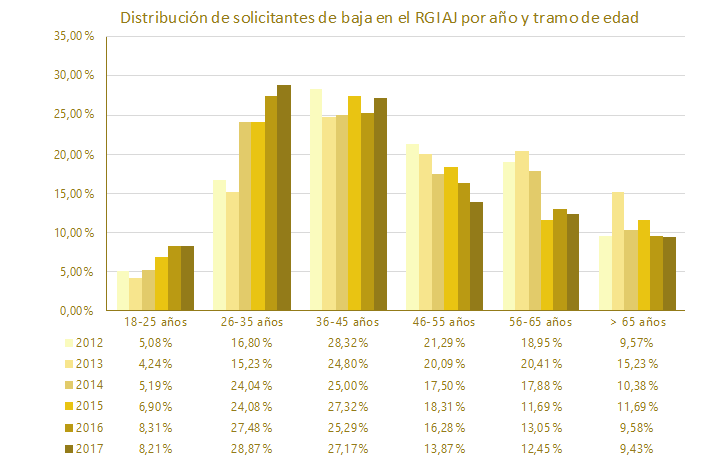
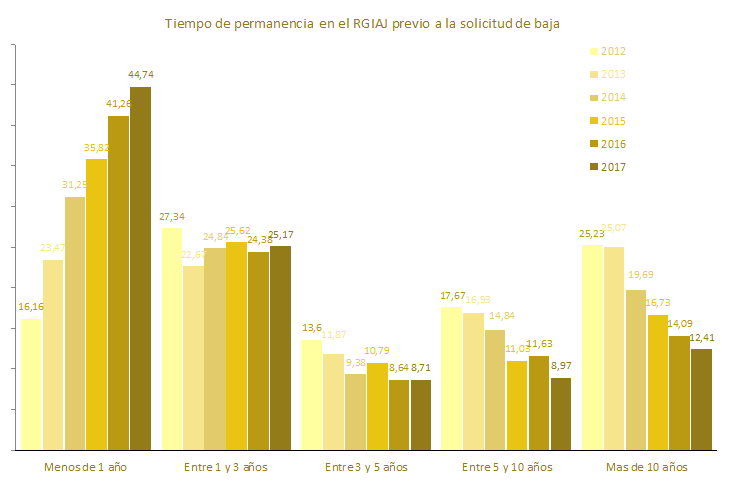
In relation to the most relevant data about these removal requests and, specifically, the time during which the registration was in force:
Regarding the analysis in relation to the sex and age of applicants requesting de-registration, we find the following data:
.png)
| 2012 | 2013 | 2014 | 2015 | 2016 | 2017 | |
|---|---|---|---|---|---|---|
| Men | 68.43% | 62.40% | 70.78% | 70.51% | 75.21% | 76.90% |
| Women | 31.57% | 37.60% | 29.22% | 29.49% | 24.79% | 23.10% |
